WCF Performance Optimization Tips
I wound up work on my last project and thought of sharing some performance challenges we faced when the product went live.
Keep in mind though that optimization options heavily rely on your application design and its usage scenarios.
Usage Scenario
The usage scenario for which the following optimizations worked are as follows. The WCF services are hosted under IIS and currently only serve requests that come from the desktop client application through the intranet. Roughly 300 instances of the client application will be used concurrently.
Long running calls
The application design used the BackgroundWorker when making calls to the server but the actual WCF call was synchronous. Synchronous calls work well in most scenarios but when your service performs a long running task (>1 sec) it blocks other clients from connecting to the server. Asynchronous calls make better sense in this scenario.
Ref: Synchronous and Asynchronous Operations
Bindings
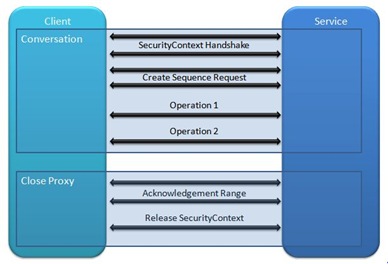
When designing your application pick the binding carefully as this also affects performance. The WCF services were initially designed to use WSHttpBinding. This binding though affects performance especially when options such as security, reliable sessions and transaction flow are enabled.
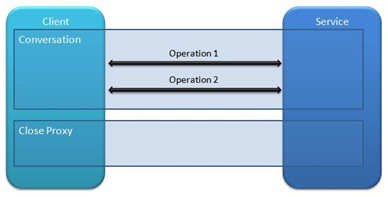
As part of the performance tuning we switched to using BasicHttpBinding as none of the WS features were actually being used by the application. This dramatically improved performance because we cut down on all the acknowledgements.
| Default WSHttpBinding with Reliable Session Enabled (9 messages) | BasicHttpBinding (2 messages) |
 |  |
The security we lost when switching over to BasicHttpBinding will be enforced at the network level by locking down the machines that are allowed to make calls to the service.
In our case we could have squeezed out more performance if we had used NetTcpBinding but that would have required IIS7 and WAS.
Ref:
- WCF Binding Comparison
- BasicHttpBinding compared to WSHttpBinding at SOAP packet level [Note: Although this author recommends WS over Basic, Microsoft specifies that the secure and reliable sessions be disabled for Load Balanced environments which basically brings it down to Basic].
- Load Balancing
Service Model Throttling
The service throttling parameters are another key element to look at when performance tuning services. The name is a little misleading though as it tends to imply that you want to throttle your service when in fact these are the default settings that the Microsoft engineers have put in place to prevent DOS attacks against your service.
In our case due to the nature of our application usage these settings caused the server to queue new requests once the default throttling levels of 10 concurrent sessions were reached. What effectively happened was that once long running queries were being processed other requests started getting queued up even though the server memory and processor usage were very low.
The resolution for this was to increase the default values for these settings (shown below) to a few thousand.
<behaviors>
<serviceBehaviors>
<behavior name="DefaultThrottlingBehavior">
<serviceThrottling maxConcurrentCalls="16"
maxConcurrentSessions="10"
maxConcurrentInstances="[Int32.MaxValue]" />
</behavior>
</serviceBehaviors>
</behaviors>
Ref:
- <serviceThrottling>
- Using ServiceThrottlingBehavior to Control WCF Service Performance
General guidelines when tuning performance
Benchmarks
When tasked with tuning for performance the first requirement is to establish benchmarks on the current service levels and the expected service level once the tuning is completed.
Identify the bottleneck
The next key point is to identify the area that is causing the bottleneck. For the WCF services we tracked the time taken on the client side against the actual execution of the web service to eliminate the network being the bottleneck.
We worked backwards from the database call to ensure that they completed within the specified time.
Having your application instrumented is a key part of the initial design. The Enterprise Library provides instrumentation and open source tools such as log4net are lightweight and effective as well.
Replicate in your dev environment
Effectively testing out any tuning options can only be done if you can repro the issue in your development environment. The built-in load tester in Visual Studio will be a key part of your load testing armoury.
Code Profiling
If the bottleneck points to your code, code profiling tools will help your isolate the problem areas. At the time of this writing Red Gate ANTS Profiler and JetBrains dotTrace are capable solutions. The code profiler built into Visual Studio 2008 is not as effective as these tools.
Finally a shout-out to WCF MVP Buddhike who saved my day by quickly pointing me towards the binding and security modes as the perf culprits.
